# Cloudwatch
#aws #cloud #monitoring #logs
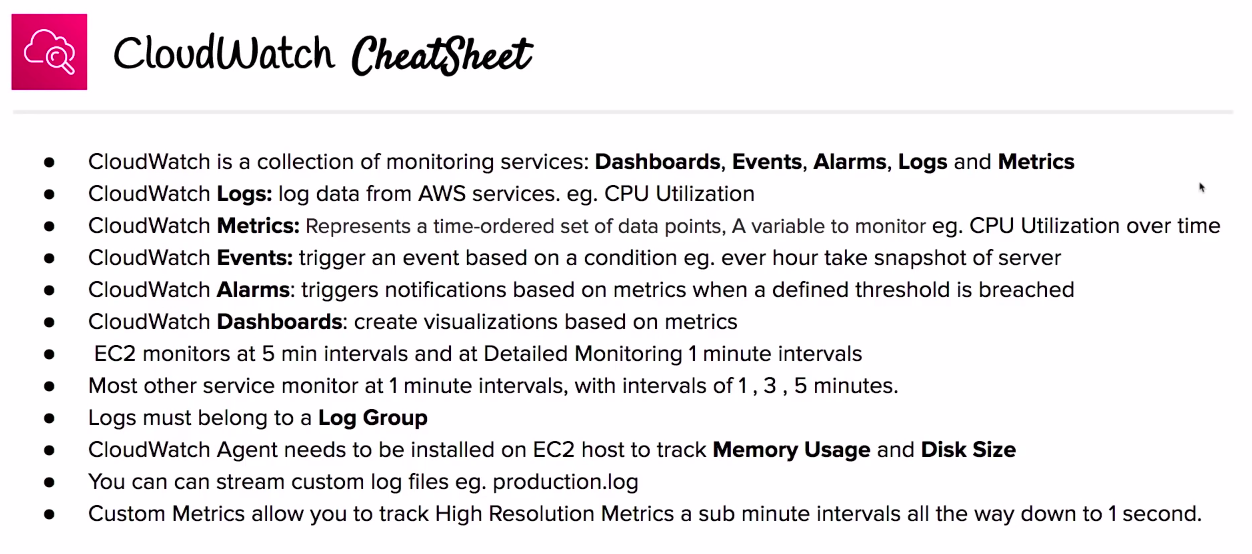
monitoring solution for all of the various AWS resources by AWS.

# Cloudwatch-Logs
Centralized collection of logs.
A Log Group is a collection of logs. Log files must belong to a log group. A log in Log Group is called a Log Stream By default, logs are kept indefinitely and never expire. logs could be sent to S3, Kinesis Data Stream or Kinesis Data Firehose.
Most AWS services are integrated with CloudWatch Logs. Logging of services sometimes need to be turned on or requires the IAM Permissions to write to CloudWatch Logs.
# CloudWatch-Metrics
Represents a tie-ordered set of data points which sends time ordered data to CloudWatch. It supports many AWS services like EC2, RDS, S3 etc.
CloudWatch comes with many predefined metrics like EC2 Per-Instance Metrics and such as CPU Utilization/ DiskReadOps, NetworkIng info. The other system-level metrics are not available by default.
# Custom Metrics
Using AWS CLI or SDK we can create and publish custom metrics. (Like Memory Utilization, Disk Usage which usually requires a cloudwatch agent).
High resolution metrics can be enabled instead of standard metrics. A high definition metrics lets you track a metric under 1 minute down to 1 second.

# Cloudwatch-Events
A feature that can trigger an event based on condition or on schedule.
# Cloudwatch-Alarms
Triggers a notification based on a metric which breach a defined threshold. here are two types:
Metric Alarm performs one or more actions based on a single metric
Composite Alarm uses a rule expression and accounts for multiple alarms.
there could be different metric alarm states.
 These alarms could be used to trigger
Auto Scaling
# Cloudwatch-Dashboards
Create custom dashboards from CloudWatch metrics.
# Cloudwatch-Availability
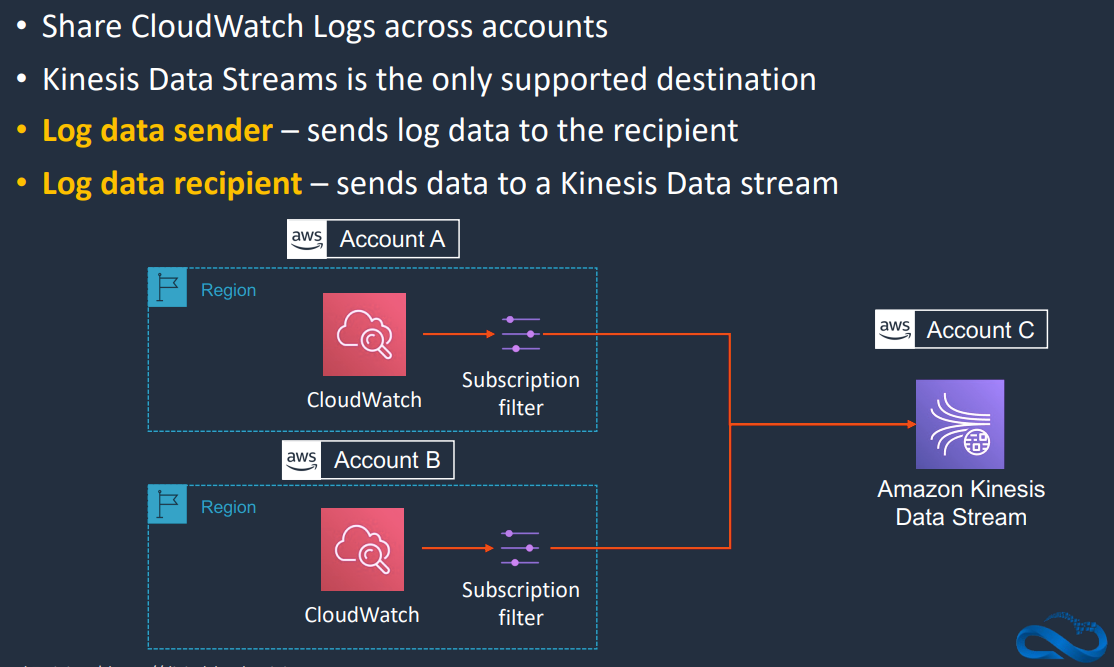
# Cross-Account Log Data Sharing
To share cloudwatch logs across accounts, you can use a
Kinesis Data Stream like shown in the following configuration.

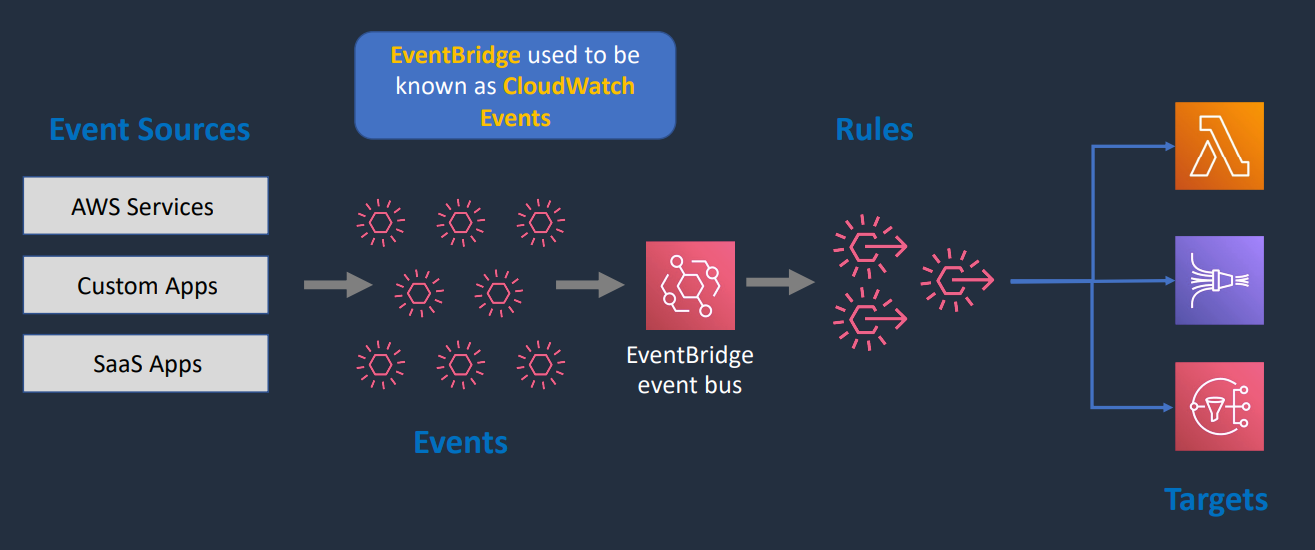
# Cloudwatch Events/ EventBridge
For creating scheduled events or any type of events see EventBridge

